Background: United States Estimated Displacement Risk (USEDR)
![]()
United States
Estimated Displacement Risk Model
The USEDR provided a foundation for the original Housing Precarity Risk Model (1.0). Please see the new HPRM 2.0 page.
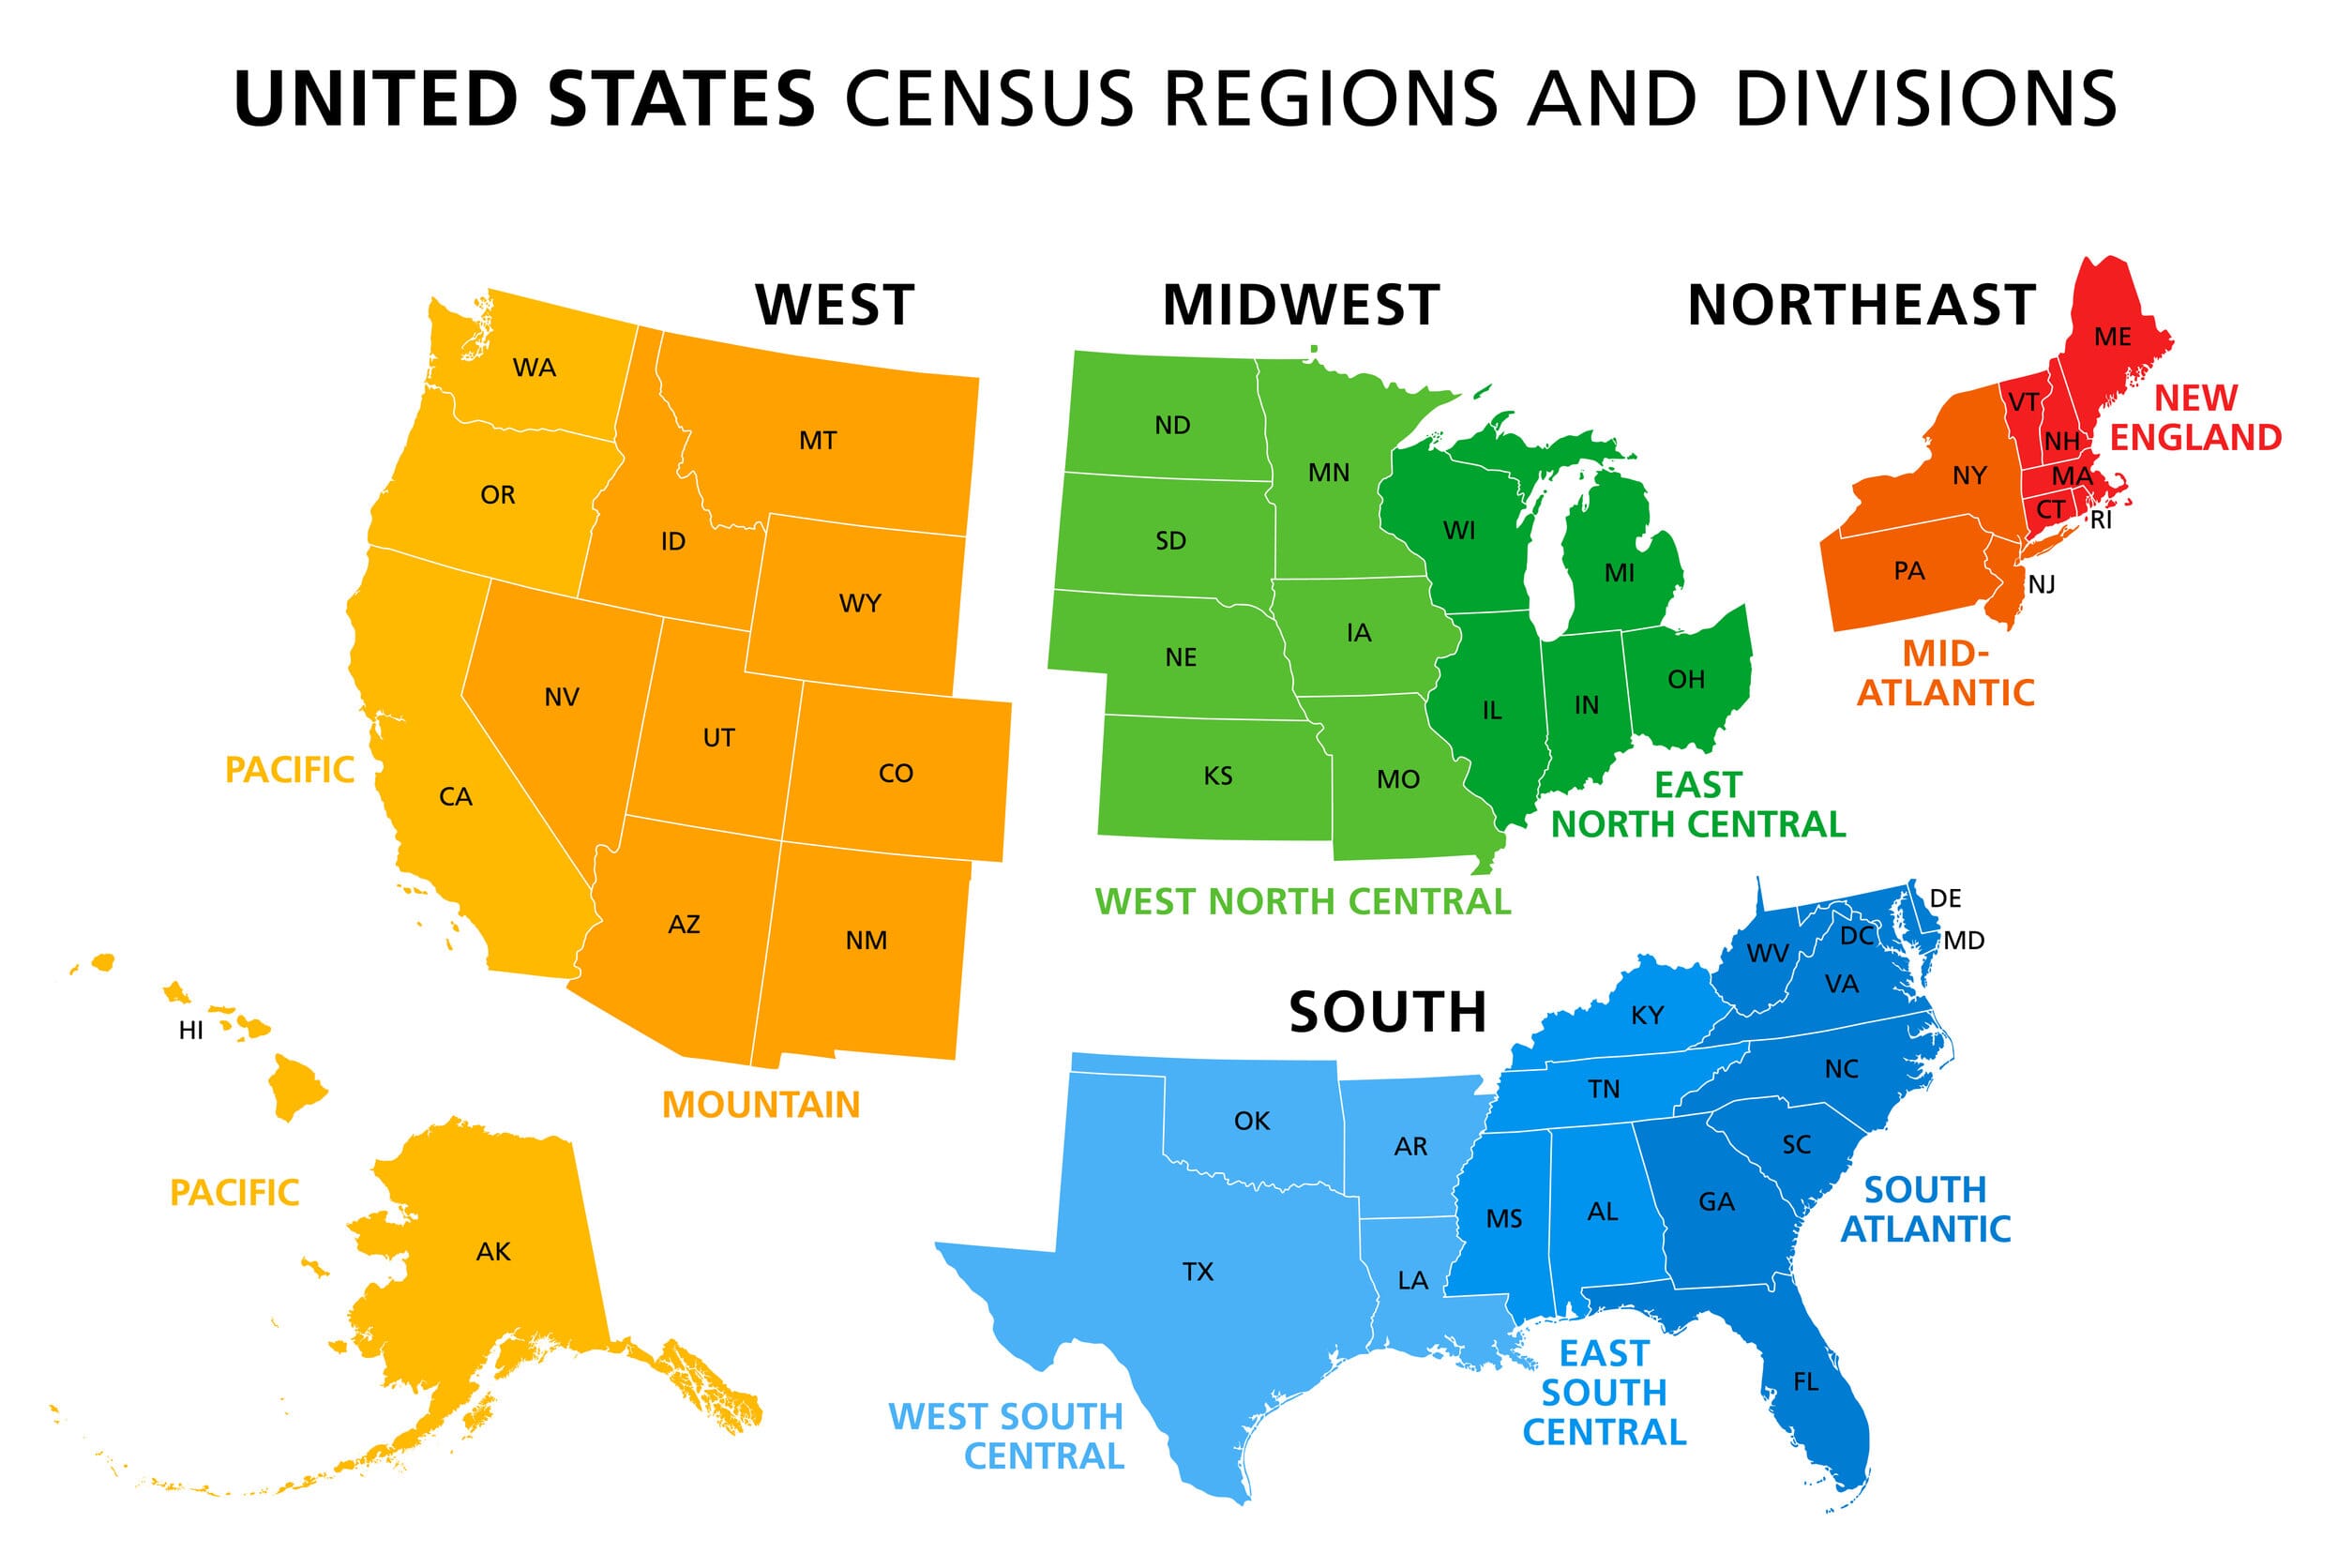
The USEDR is a national estimation of displacement for the entire U.S. The initial modeling procedure estimate displacement within U.S. sub-regions (e.g., West South Central, Pacific West, Northeast Mid-Atlantic).
State & regional revisions (June 21, 2023)
After the first model iteration, some of the regions, particularly the East South Central, had too few datapoints to derive an appropriate prediction model. Looking for alternatives Tim Thomas came across the “State Similarity Index” (Download).
The State Similarity Index attempts to quantify how similar American states are to each other relative to other states. For example, one might intuitively know that West Virginia is more like Alabama than Alaska but less like West Virginia than Kentucky. The index is a statistically-based way to measure this. The index weights equally five major aspects of states: their demographics, culture, politics, infrastructure, and geography. The research combines more than 1,000 different data points. The following paragraphs explain the exact criteria for the index more in depth:
Based on these criteria, Objective Lists created their own regional map, which we will use in our model (read more about how this regional map compares to other regional maps).

Our new state model will break up the country like this:
(Note: the original article broke up some states into western/eastern or northern/southern state divisions. We will stick with one state in the most relevant region)
Midwest
— Illinois, Indiana, Michigan, Minnesota, Ohio, Wisconsin, Iowa, Kansas, Nebraska, North Dakota, South Dakota, Missouri
Northeast
— Connecticut, Massachusetts, New Jersey, New York, Rhode Island, Pennsylvania, Delaware, Maryland, Maine, New Hampshire, Vermont
South
South Central
— Texas, Oklahoma
Southeast
— Alabama, Arkansas, Kentucky, Louisiana, Mississippi, Tennessee, Georgia, North Carolina, South Carolina, Virginia, West Virginia, Florida
West
Mountain
— Idaho, Montana, Wyoming, Colorado, Utah, Arizona, Nevada, New Mexico
Pacific
— Oregon, Washington, California
State & regional revisions 2 (June 27, 2023)
While the first revision was well intended, it created groups with over 80 million cases. The westpacific group had over 51 million people and worked, so Tim broke up the country into groups between 33 and 53 million:
| midwestgreatlakes | Pop | Total |
|---|---|---|
| Illinois | 12,812,508 | 53,075,027 |
| Ohio | 11,799,448 | |
| Michigan | 10,077,331 | |
| Indiana | 6,785,528 | |
| Wisconsin | 5,893,718 | |
| Minnesota | 5,706,494 |
| northeastnewengland | Pop | Total |
|---|---|---|
| New York | 20,201,249 | 35,317,454 |
| Massachusetts | 7,029,917 | |
| Connecticut | 3,605,944 | |
| Rhode Island | 1,097,379 | |
| New Hampshire | 1,377,529 | |
| Maine | 1,362,359 | |
| Vermont | 643,077 |
| northeastpennwash | Pop | Total |
|---|---|---|
| Pennsylvania | 13,002,700 | 38,779,804 |
| New Jersey | 9,288,994 | |
| Maryland | 6,177,224 | |
| Delaware | 989,948 | |
| District of Columbia | 689,545 | |
| Virginia | 8,631,393 |
| southatlantic | Pop | Total |
|---|---|---|
| Florida | 21,538,187 | 47,807,908 |
| Georgia | 10,711,908 | |
| North Carolina | 10,439,388 | |
| South Carolina | 5,118,425 |
| southcentral | Pop | Total |
|---|---|---|
| Texas | 29,145,505 | 33,104,858 |
| Oklahoma | 3,959,353 |
| southdeep | Pop | Total |
|---|---|---|
| Tennessee | 6,910,840 | 35,020,144 |
| Alabama | 5,024,279 | |
| Louisiana | 4,657,757 | |
| Kentucky | 4,505,836 | |
| Mississippi | 2,961,279 | |
| West Virginia | 1,793,716 | |
| Arkansas | 3,011,524 | |
| Missouri | 6,154,913 |
| westmountainmidwest | Pop | Total |
|---|---|---|
| Iowa | 3,190,369 | 34,674,664 |
| Kansas | 2,937,880 | |
| Nebraska | 1,961,504 | |
| South Dakota | 886,667 | |
| North Dakota | 779,094 | |
| Colorado | 5,773,714 | |
| Utah | 3,271,616 | |
| Idaho 1,839,106 | ||
| Montana | 1,084,225 | |
| Wyoming | 576,851 | |
| Arizona | 7,151,502 | |
| Nevada | 3,104,614 | |
| New Mexico | 2,117,522 |
| westpacific | Pop | Total |
|---|---|---|
| California | 39,538,223 | 51,480,760 |
| Washington | 7,705,281 | |
| Oregon | 4,237,256 |